On this page
What's next




Start Your Free Debt Relief Consultation
Which types of debt leave Americans feeling the most trapped?
by
JG Wentworth
•
September 1, 2026
•
12 min
In 2025, the average American carried $104,755 in debt, highlighting the significant financial burden many households face. [1] Alongside this, our own separate research in May 2026 found that debt repayment timelines vary considerably depending on the type of debt, ranging from an average of 17.5 years for mortgages to just 1.3 years for credit card debt.
Interest also has a major impact on how long it takes to become debt-free. On average, interest extends mortgage repayment by 6.8 years, increasing the timeline from 10.7 years to 17.5 years. Student loan repayment is also affected, with the average repayment period rising from 5.8 years to 7.4 years, adding 1.6 years.
While these figures show how long different types of debt can take to repay, they only tell part of the story. The emotional burden of debt can be just as significant, and some forms of debt leave people feeling far more trapped than others.
To find out which types of debt Americans feel most trapped by, we surveyed 2,233 U.S. adults and asked them about their current debts, the challenges they face, and their plans for becoming debt-free.
Key findings:
- On average, respondents rated how trapped they felt by their debt 3.2 out of 5.
- Almost two-thirds (63%) of respondents said they can only afford to make the minimum payment on their debt.
- Debt has forced 61% of respondents to delay or skip medical or dental care.
- The biggest barrier to becoming debt-free is income not being high enough to make a dent in debt, cited by 27.2% of respondents.
- Almost a quarter (23.3%) believe an inheritance, financial windfall, or lottery win, is the only way to eliminate their debt altogether.
- Millennials rated feeling trapped by their debt highest, with an average score of 3.4 out of 5.
How common is debt in America?
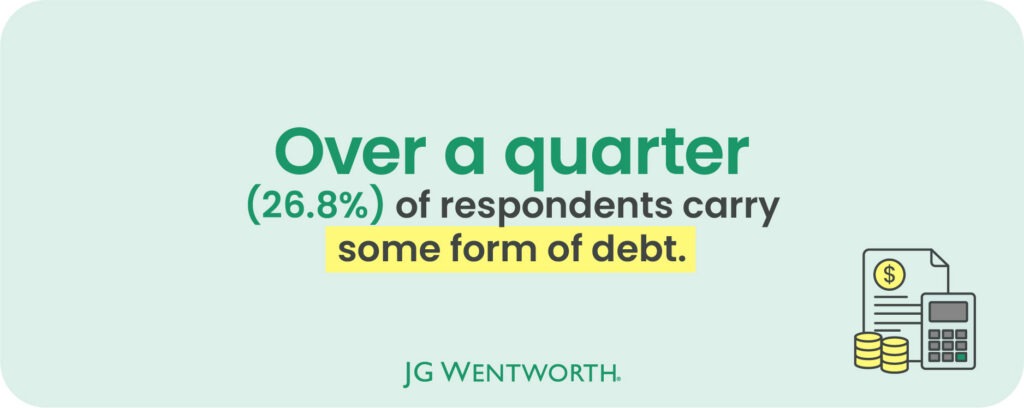
Our survey found that 26.8% of respondents currently have debt in one or more of the following categories: credit card debt, medical debt, student debt, Buy Now, Pay Later (BNPL) loans, auto loans, loans from friends or family, personal loans, or a mortgage.
Nationally, household debt continues to rise. According to the Federal Reserve Bank of New York, total U.S. household debt reached $18.39 trillion in the second quarter of 2025, with mortgages, auto loans, student loans, credit cards, and home equity lines of credit making up the largest share. [2]
In our survey, debt was most common among adults aged 29 to 44, with 37.6% reporting they were in some form of debt, followed by those aged 45 to 60 at 22%. The survey also revealed differences by gender. Women were significantly more likely than men to report being in debt, with 42.6% of women carrying debt compared with 24.2% of men.
Income did not always predict whether someone was in debt. Respondents earning $50,000 to $74,999 had the highest proportion of people in debt, at 20.2%. By comparison, 13.4% of those with no income reported being in debt, while 11.4% of those earning less than $10,000 a year said the same.
Mortgages account for the largest share of debt held by Americans
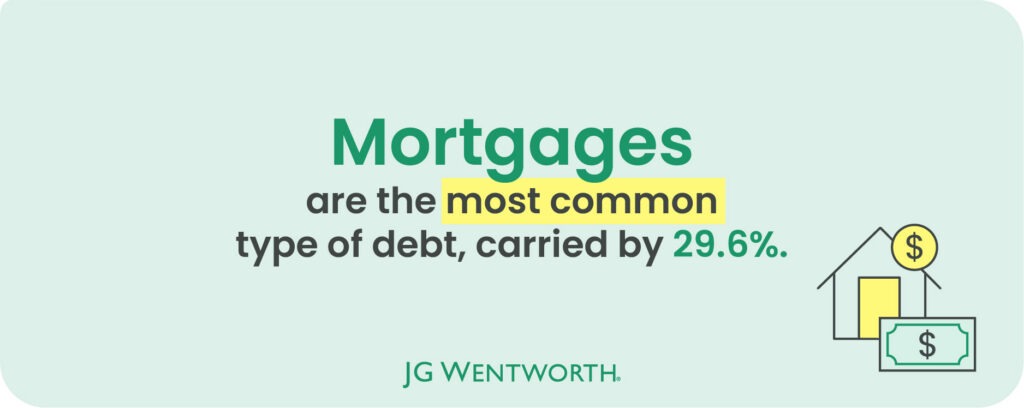
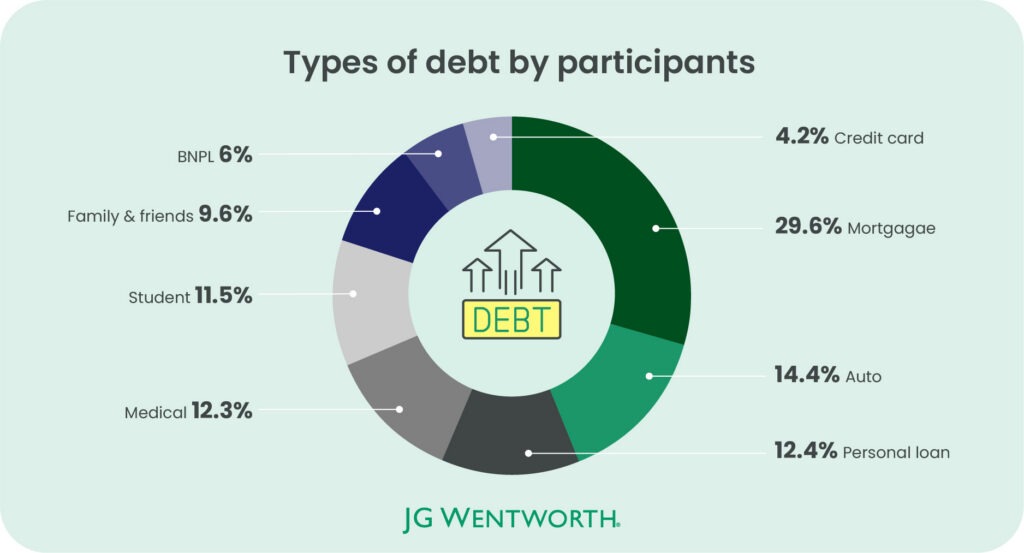
While mortgages accounted for the largest average balances, they were also the most common type of debt among respondents. Nearly three in ten (29.6%) respondents with debt reported having a mortgage, making it the most widely held debt type in the survey.
Auto loans were the second most common, held by 14.4% of respondents, followed by personal loans (12.4%) and medical debt (12.3%). Student debt was also relatively common, with 11.5% of respondents reporting outstanding student loans.
Other forms of debt were less common but still represented a smaller share of respondents. Nearly one in ten (9.6%) reported owing money to family and friends, while 6% had Buy Now, Pay Later (BNPL) debt and 4.2% carried credit card debt.
Although just 9.6% said they currently owe money to friends and family, our 2025 research suggests the true lifetime figure is much higher. More than half (51.6%) reported having borrowed money from a friend or family member at least once in their lives.
Overall, the findings highlight that debt is not limited to traditional borrowing methods. While mortgages and loans make up the largest share of debt held by respondents, personal borrowing, medical costs, and newer forms of credit such as BNPL also contribute to the financial pressures Americans face.
Average debt amount per type
Among respondents with debt, mortgages accounted for the largest average balance, with participants owing $24,248 on average. This was significantly higher than other debt types, reflecting the long repayment timelines often associated with home loans.
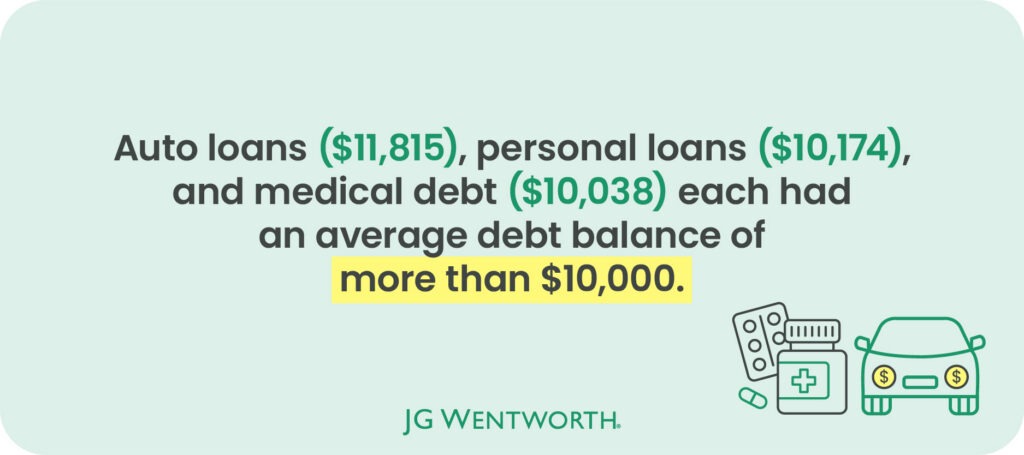
Beyond mortgages, auto loans ($11,815), personal loans ($10,174), and medical debt ($10,038) were the only other categories where average balances exceeded $10,000.
Student debt followed closely behind, with respondents holding an average of $9,392. Meanwhile, debt owed to family and friends averaged $7,851, showing that informal borrowing can also represent a significant financial burden.
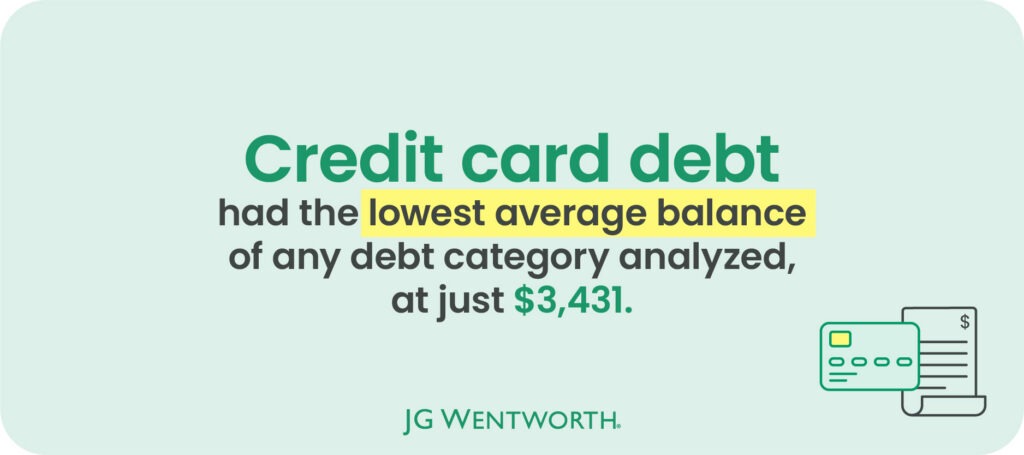
The smallest average balances were found among Buy Now, Pay Later (BNPL) debt ($4,911) and credit card debt ($3,431). However, despite having lower average balances, these types of debt were among those respondents felt most trapped by, suggesting that the emotional impact of debt is not always linked to the amount owed.
Average amount of debt held per type
| Debt type | Average amount held |
|---|---|
| Mortgage | $24,248 |
| Auto | $11,815 |
| Personal loan | $10,174 |
| Medical | $10,038 |
| Student | $9,392 |
| Family & friends | $7,851 |
| BNPL | $4,911 |
| Credit card | $3,431 |
Six in ten (60%) have had to cut back on essentials because of their debt
For many respondents, keeping up with debt repayments has come at a significant cost. Nearly two-thirds (63%) said they could only afford to make the minimum payment on their debt.
The financial strain has also affected other areas of their lives. Six in ten (61%) said they had delayed or skipped medical or dental care because of their debt, while 60% had cut back on essentials such as food or heating. A further 58% admitted to missing or making late debt payments.
Despite these financial challenges, only 7% said their debt had affected their mental health or sleep. This contrasts with findings from our previous research into the relationship between debt and sleep, which found that respondents lost sleep because of their finances on an average of 2.7 nights per week, almost half the week.
How debt affects other aspects of life
| Life impact | Percentage of respondents |
|---|---|
| Only able to afford minimum payments | 63% |
| Delayed/skipped medical or dental care | 61% |
| Cut back on essentials (food, heating...) | 60% |
| Missed or made late payments | 58% |
| Borrowed more to cover existing debt | 13% |
| Strained relationships / family life | 11% |
| Credit score dropped | 11% |
| Put off major life goals (home, kids) | 10% |
| Affected mental health (sleep, anxiety) | 7 |
One in ten (10%) respondents said they had put off major life goals, such as buying a home or starting a family, because of their debt. Meanwhile, 11% said their debt had strained personal relationships and negatively affected their credit score.
Which debt do Americans feel most trapped by?
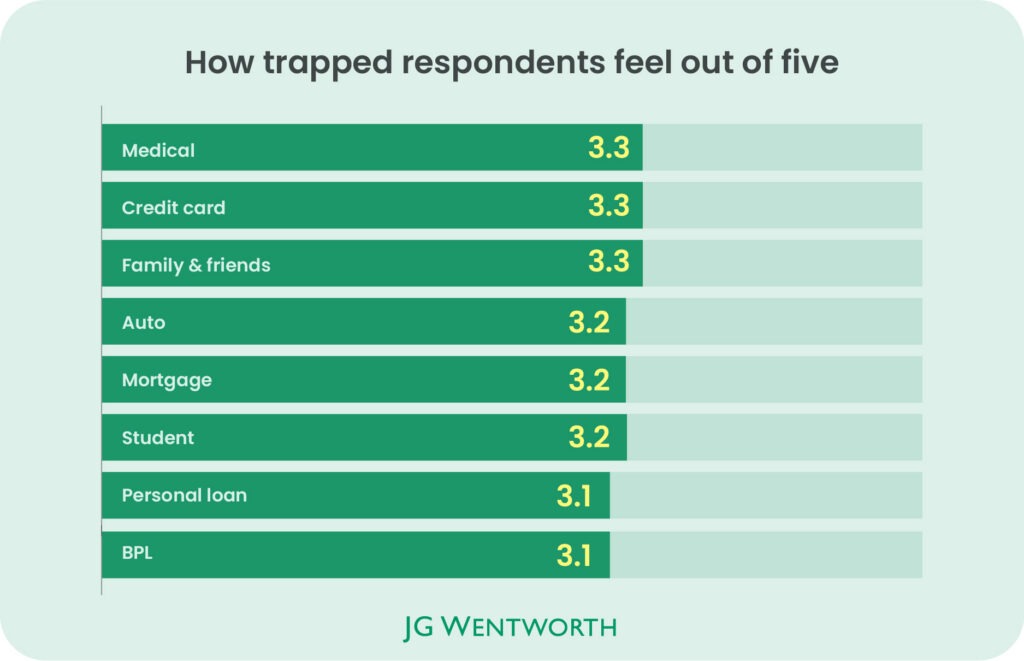
Although some types of debt are often viewed as more burdensome than others, our findings suggest the emotional impact is remarkably similar across the board. Across all debt types analyzed, there was just a 0.2 point difference between the highest and lowest average ratings for feeling trapped. On average, respondents rated how trapped they felt by their debt 3.2 out of 5.
Credit card debt, medical debt, and debt owed to friends or family were rated as the most trapping, each receiving an average score of 3.3 out of 5.
At the other end of the scale, Buy Now, Pay Later (BNPL) debt and personal loans received the lowest average rating of 3.1 out of 5.
Student loans, auto loans, and mortgages all fell in the middle, with an average rating of 3.2 out of 5, despite auto loans and mortgages having the highest average debt amounts.
While some debts carry larger balances than others, our findings suggest that the feeling of being trapped is not determined by the amount owed alone. Instead, factors such as repayment timelines, interest costs, and whether the debt was expected may influence how stressful it feels.
For example, credit card debt had one of the lowest average balances among the debt types analyzed, yet it was rated among the debts respondents felt most trapped by.
In comparison, although mortgages accounted for the largest average debt balance among respondents, they were not the debt type people felt most trapped by. Instead, credit cards, medical debt, and money owed to friends and family ranked highest.
Millennials are more likely to feel trapped by their debt
The findings show that feelings of being trapped by debt vary across generations, with younger adults reporting higher levels of financial strain than older respondents.
On average, Millennials (aged 29 to 44) reported feeling the most trapped by their debt, giving it an average rating of 3.4 out of 5. Generation X (aged 45-60) followed with an average rating of 3.2 out of 5, and Generation Z (aged 18 to 28) with an average rating of 3.1 out of 5.
In contrast, Baby Boomers (aged 61 to 79) reported feeling less trapped, with an average rating of 2.9 out of 5. Respondents aged 80 and over gave the same average rating.
Higher earnings ≠ feeling less trapped by debt
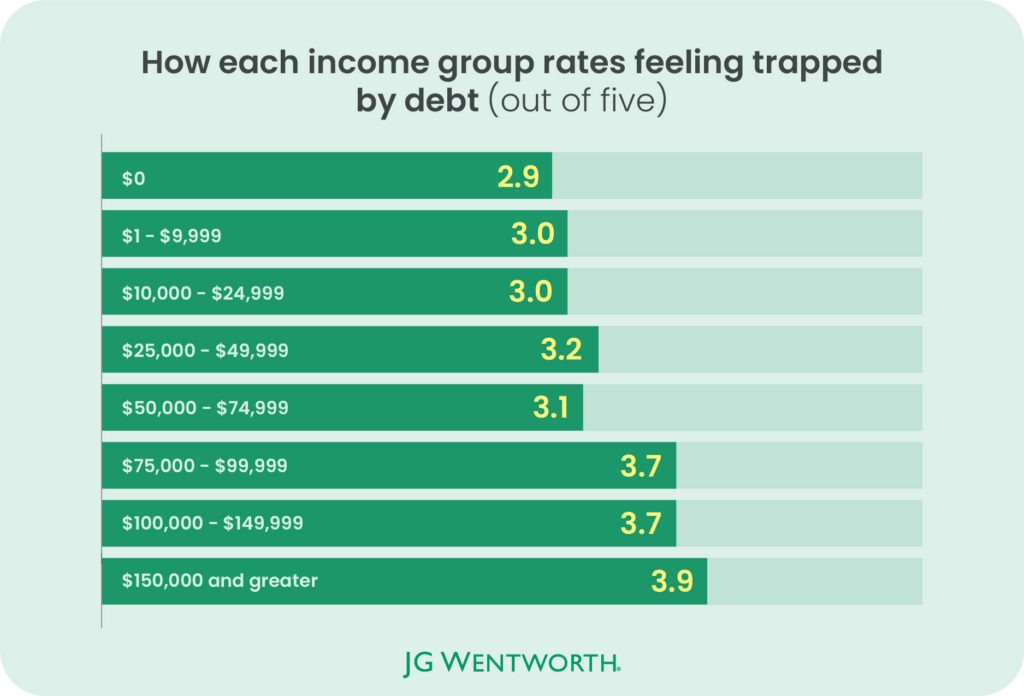
A similar pattern emerged when comparing income with how trapped respondents felt by their debt. In fact, some of the highest earners reported the greatest sense of financial pressure.
Respondents with no income gave an average rating of 2.9 out of 5 for how trapped they felt by their debt. By comparison, those earning more than $150,000 a year reported the highest average rating at 3.9 out of 5.
These findings suggest that feeling trapped by debt is not solely determined by income. Regardless of earnings, the size of repayments, lifestyle costs, and financial commitments can all influence how burdensome debt feels.
What would it take to become debt free?
We asked respondents what they believed was preventing them from becoming debt-free. The most common barrier was not earning enough to make meaningful progress, with 27.2% saying their income wasn’t high enough to make a dent in their debt.
The next biggest challenge was the cost of interest and fees, cited by 22.9% of respondents. A further 18.3% said their balance was growing faster than they could pay it down, while 17% said their debt was the result of unexpected circumstances outside of their control.
Finally, 11.5% of respondents said they didn’t fully understand the terms of their debt, suggesting that a lack of clarity around borrowing may also be preventing some people from becoming debt-free.
What is preventing respondents from escaping their debt?
| Reason preventing participants from escaping debt | Percentage of respondents |
|---|---|
| Income isn't enough to make a dent | 27.20% |
| The interest or fees are too high | 22.90% |
| The balance keeps growing faster than they can pay it | 18.30% |
| It was unexpected / outside their control | 17% |
| Don't fully understand the terms | 11.50% |
Almost a quarter (23.3%) said it would take a windfall to become completely debt free
When asked what it would take to become completely debt-free, the most common response was cutting back on everyday spending, with 25.3% of respondents saying this would help them clear their debt.
Top five ways to becoming debt free
| Rank | What would it take to become debt free? | Percentage of respondents |
|---|---|---|
| 1 | Cutting back on everyday spending | 25.30% |
| 2 | An inheritance, windfall, or lottery win | 23.30% |
| 3 | A significant pay rise or new job | 22.20% |
| 4 | Debt forgiveness or government relief | 16.40% |
| 5 | Bankruptcy | 9.70% |
However, almost as many (23.3%) believed it would take something far more significant, such as an inheritance, financial windfall, or lottery win, to eliminate their debt altogether.
For slightly over a fifth (22.2%), a significant pay rise or new job is the answer to overcoming their debt, and 16.4% said they would need to rely on debt forgiveness or government relief. Debt relief is an umbrella term that covers a range of strategies to make debt more manageable, including debt settlement, consolidation, and repayment plans. Debt forgiveness is one form of debt relief in which a creditor agrees to cancel part or all of the amount owed, often as the result of a negotiated debt settlement.
On the other hand, almost one in ten (9.7%) said bankruptcy was the only way they could realistically become debt free.
How long will it take to become debt free?
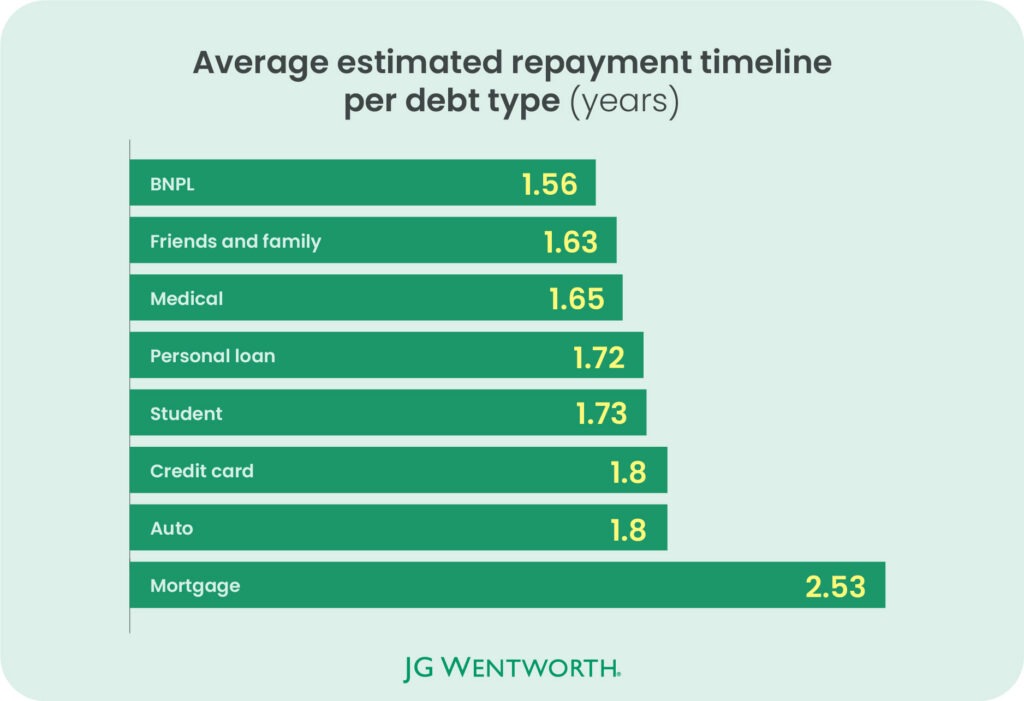
The survey asked respondents how long they expect it will take to become completely debt-free for each type of debt analyzed. This figure reflects respondents’ own perceptions of how long it would take to repay a mortgage, rather than the repayment timeline calculated from loan balances, payments, and interest. In a separate JG Wentworth analysis, mortgages were estimated to take an average of 17.5 years to repay when interest was included. The 2.53-year estimate also appears optimistic compared with the typical U.S. mortgage term of 30 years, although borrowers may pay off, refinance, or move before the full term ends.
In contrast, Buy Now, Pay Later (BNPL) debt had the shortest estimated repayment timeline, with respondents expecting to pay it off in an average of 1.56 years. This was followed by debt to friends and family (1.63 years) and medical debt (1.65 years).
Methodology
A survey was conducted on behalf of JG Wentworth in July 2026 and asked 2,233 U.S. adults questions relating to their debt.
The questions covered topics including types of debt, how much debt they owe, how trapped they feel by this debt, and what it would take to overcome this debt.
Demographics:
Age
- 18-28 – 19.2%
- 29-44 – 37.1%
- 45-60 – 17.5%
- 61-79 – 12.9%
- 80+ – 13.3%
Gender
- Female – 40.5%
- Male – 20.6%
- Prefer not to say – 13.9%
- Non-binary – 12.7%
- Not listed – 12.3%
Sources
[1] Experian, ‘Average American Debt by Age in 2025’, 2025
[2] Federal Reserve Bank of New York, ‘Center for Microeconomic Data’, 2026
[3] SoFi, ‘What Is the Average Mortgage Term in the US?’, 2026

About the author