On this page
What's next


Earn a high-yield savings rate with JG Wentworth Debt Relief
The true cost of medical emergencies
by
JG Wentworth
•
April 1, 2026
•
14 min
Nearly all Americans have health insurance, yet coverage alone is often not enough to protect households from financial strain. Medical debt is widespread, with Americans owing $220 billion in total, according to the latest figures. [1]
Medical emergencies can push families beyond their financial limits, with our recent survey results showing $4,354 is the average breaking point.
To learn more about medical needs and financial strains, we surveyed 1,507 U.S. adults to explore how prepared households really are for medical costs, who is most vulnerable, and how quickly medical bills can turn into a long-term financial burden.
Key statistics
- 96.6% of respondents have health insurance, yet 94.7% of the insured still worry about hospital bills.
- Around 3.4% of respondents said they do not currently have health insurance, which would equate to roughly 11 million Americans.
- One doctor’s visit costing up to $600 could put over three quarters (76.5%) of uninsured Americans into financial hardship.
- The average American would begin to experience financial hardship from medical bills at round $4,354.
- 85.1% of respondents report having medical debt, with 81.3% owing between $1,000 and $10,000.
- Nearly one in three people with long-term health conditions (31.8%) say their health has worsened because they could not afford medication.
Most have insurance, but concerns are still common
Most Americans have health insurance; our survey found that 96.6% of respondents reported currently having coverage. Based on the latest U.S. population estimate of around 334 million people, that would equate to roughly 320 million Americans being insured. [2]
Despite strong coverage overall, it wasn’t uniform across all groups, with gaps depending on age, gender, employment status, and income.
Younger adults (18-28) are more insured than those near retirement age (45-60)
The majority of respondents are covered across all age groups, but there’s still a discrepancy between different ages, with 100% of those aged 61 and older reporting having health insurance; coverage was lowest among those aged 45 to 60, where 85.6% said they were insured.
The youngest age group (18-28) had the second-lowest coverage rate (94.5%) but trumped those nearing retirement age (45-60). But this could be down to parent-based plans that can cover you up to 26 years old, even if you’re married, have a child, or live in your own home. [3]
Number of people with health insurance by age group
| Age group | Percentage of those with health insurance (%) |
|---|---|
| 18–28 | 94.50% |
| 29–44 | 98.30% |
| 45–60 | 85.60% |
| 61-79 | 100% |
Two-thirds of those who are unemployed are also uninsured
It might not come as a surprise that unemployed respondents are less likely to be insured. Employment status showed the clearest divide in insurance coverage, with unemployed respondents far less likely to have insurance than those in work. Our previous research on common reasons for debt highlights how economic pressures can quickly build, with the U.S. unemployment rate standing at around 4.3%, representing millions of Americans currently out of work. [4]
While 95.5% of full-time employees said they were insured, coverage fell to just 66.7% among those who were unemployed (combining both those actively seeking work and those not currently looking).
This suggests that insurance access remains closely tied to stable employment, even as overall health insurance coverage remains prevalent.
Those earning $75,000 to $99,999 are most likely to be uninsured
Coverage was highest among those earning between $100,000 and $149,999, where 100% said they were insured. At the lower end of the scale, coverage was weaker, with 74.4% of those earning between $1 and $9,999, followed by 71.4% of those with no income.
Only 86.6% of those earning between $75,000 and $99,999 had health insurance. The dip among middle-to-high earners may partly reflect how eligibility for financial support is structured. Individuals in this income range are often above the threshold for marketplace subsidies, meaning they may not qualify for reduced premiums and must rely on employer coverage or pay the full cost of private plans. [5]
Percentage of respondents with health insurance by income group
| Income group | Percentage with health insurance (%) |
|---|---|
| $0 | 71.40% |
| $1 – $9,999 | 74.40% |
| $10,000 – $24,999 | 99.20% |
| $25,000 – $49,999 | 97.90% |
| $50,000 – $74,999 | 95.60% |
| $75,000 – $99,999 | 86.60% |
| $100,000 – $149,999 | 100% |
| $150,000 and greater | 84.60% |
Many insured Americans still worry about medical costs
Despite the majority of respondents being insured, there’s still concern about medical costs, with most worried about being hospitalized unexpectedly.
Most insured Americans (94.7%) worry about hospital bills
Concerns about hospital bills remain, even among those with health insurance, with 94.7% reporting some level of worry about affordability.
When asked about unexpected hospitalization, 85.1% of insured respondents said they were somewhat worried about paying medical bills, while 9.6% said they were very worried. Just 5.3% said they were not worried at all.
This shows how concern about medical costs persists even among people who currently have insurance.
Confidence in coverage is limited
Having medical coverage isn’t always enough to keep you safe from huge expenses, with nearly one in four (23%) of Americans being underinsured, which means that they are exposed to high out-of-pocket and unaffordable costs despite having insurance. [6]
The survey reflects some of that uncertainty, with only 12.4% of insured respondents feeling very confident that their insurance would prevent financial hardship in the event of a serious medical issue. Although the majority (83.4%) were somewhat confident, the remainder were either not very confident (2.7%) or not confident at all (1.4%).
On top of monthly premiums, individuals may still be required to pay deductibles before coverage begins, copayments for specific services, or higher charges when using out-of-network providers.
Different types of health insurance plans are designed to share costs between the insurer and the individual, meaning that coverage does not always eliminate financial responsibility. [7]
More than nine in ten insured Americans have delayed care due to cost
The survey showed that over nine in ten (92%) of insured respondents had delayed or avoided medical care because of concern about cost.
In fact, 95% of those surveyed said a medical emergency would likely put them into serious debt even with insurance.
Younger adults are most likely to delay care
Younger respondents were the most likely to report delaying or avoiding treatment due to cost.
94.2% of those aged 18 to 28 and 93.7% of those aged 29 to 44 said they had postponed care despite being insured.
Although emphasized among younger age groups, delaying treatment due to cost was still common across much of the population. Around 75.9% of those aged 45 to 60 also reported delaying or avoiding medical care despite being insured.
Those aged 61 and over were the only group where this was less common, with 45.8% saying they had delayed treatment.
Women are more likely to postpone medical treatment
Women were slightly more likely than men to delay or avoid medical care due to cost.
93.9% of women said they had postponed treatment for financial reasons, compared to 89% of men, suggesting that cost concerns are shaping healthcare decisions across both groups, but with a marginally greater impact among women.
Around 11 million Americans could be uninsured
While most report being insured, 3.4% of respondents reported being uninsured; this equates to around 11 million people when using the current U.S. population. [2]
The costs are significantly higher for those without health insurance for the entire calendar year, paying almost 40% of their care costs. Uninsured patients are often charged a higher rate than those with private health insurance or public programs. [8]
Younger adults make up the largest share of the uninsured
Among the participants who said they don’t currently have health insurance, the highest proportion were aged between 18-28 (37.3%). Those aged 29-44 accounted for 35.3% of uninsured respondents, compared with 27.5% aged 45-60.
Share of respondents who are uninsured by age group
| Age group | Percentage of respondents (%) |
|---|---|
| 18–28 | 37.30% |
| 29–44 | 35.30% |
| 45–60 | 27.50% |
| 61-79 | 0% |
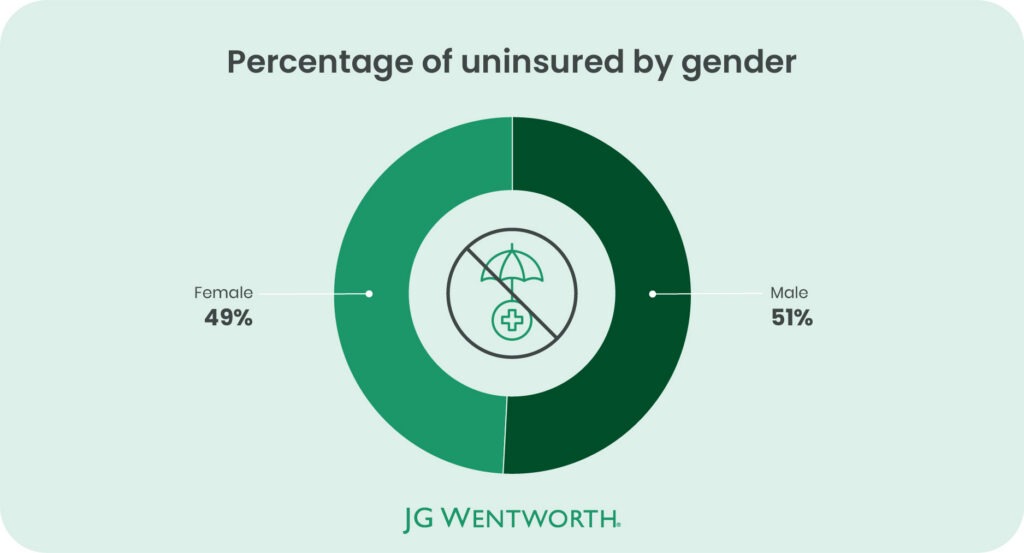
Men made up a slightly larger share of the uninsured
Men made up a slightly larger share of uninsured respondents, accounting for just over half (51%) of those without health insurance, compared to 49% of women.
One doctor’s visit could cause financial hardship for more than three-quarters (76.5%) of the uninsured
Financial vulnerability among uninsured respondents was widespread, with over three-quarters of uninsured respondents (76.5%) saying that $600 or less could cause financial hardship.
More worryingly, as little as $200 or less was most likely to financially break those without insurance, with 23.5% saying that it could cause financial hardship, and 13.7% reported that any out-of-pocket costs would be too much for them.
When these financial limits are compared to the typical cost of medical care, it highlights the vulnerability of the uninsured population. According to Mira, somebody without health insurance could expect to pay between $150 and $600 for a doctor’s appointment. If we assume it to be the higher limit of this range, then one doctor’s appointment is enough to cause financial stress for over half of the uninsured population in the U.S. [9]
To put into perspective some of the medical procedures and appointments that could take someone uninsured into hardship, here are some general costs:
General medical costs
| Procedure/Test | Typical Cost Range |
|---|---|
| CT scan | $270–$5,000 |
| Colonoscopy | $1,250–$4,800 |
| MRI | $500–$3,000 |
| Echocardiogram | $500–$3,000 |
| Upper endoscopy | $800–$2,500 |
| Blood allergy panel | $200–$1,000 |
| Basic blood work panel | $300–$650 |
| Ultrasound | $200–$600 |
| Skin biopsy | $150–$350 |
| Joint injection | $125–$350 |
| Allergy skin testing | $60–$300 |
| Basic X-ray | $100–$250 |
| Cholesterol panel | $130–$200 |
| EKG | $50–$200 |
| Vaccinations | $20–$200 |
| Thyroid panel | $100–$195 |
The average American’s financial breaking point is $4,354
Across all respondents, the average amount they said they could personally afford to pay out of pocket before experiencing serious financial hardship was $4,354.
Over a third (36.4%) of respondents said medical bills would begin to interfere with financial obligations between $3,000 and $4,999, while another 33.7% said it would start between $5,000 and $9,999. Combined, that means seven in ten (70.1%) Americans say that an unexpected medical bill under $10,000 would interfere with their ability to cover essential expenses.
Only a small minority indicated they could withstand costs over that amount, with 2.7% being able to cover $10,000 or more without financial hardship.
By age
When comparing the amount of out-of-pocket costs people can afford by age group, it was 61-79 year olds who could cover the most ($4,958) before experiencing serious financial issues, more than the average ($4,354), while 18-28 and 29-44 year olds can also cover more than the average American, with $4,582 and $4,531, respectively.
The lowest average amount by age group was $1,516 by 45-60-year-olds.
The average amount of out-of-pocket costs each age group can cover
| Age Group | Average Out-of-Pocket Amount ($) |
|---|---|
| 18–28 | $4,582 |
| 29–44 | $4,531 |
| 45–60 | $1,516 |
| 61–79 | $4,958 |
By income
Income levels mostly correlated with the average out-of-pocket costs that people could afford, with those in the highest bracket ($150,000) being able to afford the most ($5,637) and those earning between $1 and $9,999 being able to afford the least ($948). Breaking that pattern was the no-income group, who could afford more than those earning $1–$9,999, with an average of $2,100 in out-of-pocket costs.
The average amount of out-of-pocket costs each income-level group can cover
| Income Level | Average Out-of-Pocket Amount ($) |
|---|---|
| $0 | $2,100 |
| $1 – $9,999 | $948 |
| $10,000 – $24,999 | $5,303 |
| $25,000 – $49,999 | $4,780 |
| $50,000 – $74,999 | $1,610 |
| $75,000 – $99,999 | $1,812 |
| $100,000 – $149,999 | $2,993 |
| $150,000 and greater | $5,637 |
Medical bills are already pushing Americans into debt
The majority (85.8%) of those surveyed reported missing or making late payments on expenses such as mortgage payments, credit card payments, and household bills.
When asked how they would manage a $5,000 medical bill, over a third (34.7%) said they would not be able to pay the bill outright. A further 3.2% said they would use a credit card and carry a balance, while 1.2% said they would take out a personal or medical loan. In order to pay a medical bill, 41.9% said they would use savings or retirement funds, while 35.2% would reduce childcare or education spending to manage medical expenses.
Additionally, 82.2% said they have reduced spending on essential expenses because of medical bills, showing the real effect medical care can have on day-to-day life for Americans, emphasizing exactly why 94.7% of people with insurance worry about their medical coverage.
For households already facing rising costs, unexpected medical bills can add another layer of financial pressure, prompting many to seek debt relief or other financial support options.
Four in five Americans with medical debt owe between $1,000 and $10,000
Survey results show that most respondents (85.1%) are in medical debt and of those, 81.3% are in debt between $1,000 and $10,000.
The single largest group (41%) carries balances between $5,000 and $9,999, while another 40.3% owe $1,000 to $4,999. Using weighted midpoints, the average balance sits at $4,367.
For many households, that figure alone is at or above the amount they previously said would trigger serious financial hardship.
Most expect medical debt to last up to three years
Only 6.7% of those surveyed believe they can clear their medical debt within a year, with the majority (89.5%) believing it will take between one and three years to pay off.
A small group of just 2.9% expect it to take more than three years, and 0.9% never expect to repay it at all.
Cost pressures are affecting health outcomes
Most respondents (88.7%) had long-term health conditions, including asthma, heart disease, diabetes, or high blood pressure. Among respondents with long-term conditions, nearly one in three (31.8%) said their condition has worsened because they could not afford their medication.
In comparison, 31.5% admitted skipping doses, making their condition harder to manage. This brings a serious issue to the surface, showing the effect of medical conditions and the cost that surrounds them, with over half (57.9%) of respondents admitting that they have struggled to afford essential medicines or treatments on more than one occasion, including 10.2% who said they struggle every time they need to refill their prescription.
The impact extends beyond physical health, 30.5% said medical costs have affected their mental health, highlighting how financial pressure and health are deeply intertwined. Which comes as no surprise, considering most (95.6%) of those surveyed with long-term conditions said they had to choose between medication and essentials such as food.
Methodology
The survey was conducted in February 2026 and asked 1,507 U.S. adults questions about their medical insurance coverage, concerns and financial pain points when it comes to healthcare.
For some questions, respondents were able to select multiple answers, therefore the results do not all add up to 100%.
The demographics of the survey respondents were:
Gender:
- Male – 36.2%
- Female – 63.6%
- Prefer not to say – 0.1%
- Non-binary – 0.1%
Age:
- 18-28 – 23%
- 29-44 – 68.9%
- 45-60 – 6.4%
- 61-79 – 1.6%
- 80+ – 0.1%
Personal income level:
- $0 – 0.5%
- $1 – $9,999 – 2.9%
- $10,000 – $24,999 – 39.5%
- $25,000 – $49,999 – 38%
- $50,000 – $74,999 – 9%
- $75,000 – $99,999 – 6.4%
- $100,000 – $149,999 – 2.5%
- $150,00 and greater – 0.9%
- Prefer not to say – 0.4%
Employment status:
- Self-employed – 52.2%
- Employed full-time – 40.1%
- Employed part-time – 3.6%
- Unemployed and looking for work – 1%
- Full-time homemaker – 0.7%
- Retired – 0.7%
- Freelancing – 0.7%
- Student – 0.6%
- Unemployed and not looking for work – 0.2%
- Other – 0.2%
Sources
- Kaiser Family Foundation. “The Burden of Medical Debt in the United States,” https://www.kff.org/health-costs/the-burden-of-medical-debt-in-the-united-states/.
- U.S. population & insurance baseline:
U.S. Census Bureau, QuickFacts: United States — Population Estimates (2024). https://www.census.gov/quickfacts/fact/table/US/PST045224 - Young adult coverage (parent plans):
HealthCare.gov, “Health Insurance Coverage for Young Adults,” Children Under 26 page. https://www.healthcare.gov/young-adults/children-under-26 - U.S. Bureau of Labor Statistics,
Civilian unemployment rate. https://www.bls.gov/charts/employment-situation/civilian-unemployment-rate.htm - Marketplace subsidy context:
Healthcare Insider, ACA Subsidy Calculator & Eligibility Explanation. https://healthcareinsider.com/aca-subsidy-calculator - Coverage & underinsurance national data:
Commonwealth Fund, State Health Insurance Coverage in the U.S., 2024 Biennial Survey. https://www.commonwealthfund.org/publications/surveys/2024/nov/state-health-insurance-coverage-us-2024-biennial-survey - Explanation of health insurance plan types:
WebMD, Types of Health Insurance Plans. https://www.webmd.com/health-insurance/types-of-health-insurance-plans - Uninsured population out-of-pocket burden:
Kaiser Family Foundation, Key Facts About the Uninsured Population. https://www.kff.org/uninsured/key-facts-about-the-uninsured-population/ - Typical doctor visit cost without insurance:
Talk to Mira, The Cost of a Doctor Visit Without Insurance. https://www.talktomira.com/post/the-cost-of-a-doctor-visit-without-insurance

About the author