On this page
What's next


Earn a high-yield savings rate with JG Wentworth Debt Relief
Reality check: Do people really know how much things cost?
by
JG Wentworth
•
June 2, 2025
•
13 min
Key findings:
- Respondents underestimated the monthly expenses of housing, car finance, gasoline, and groceries of a typical American by a combined $463 a month ($5,556 a year).
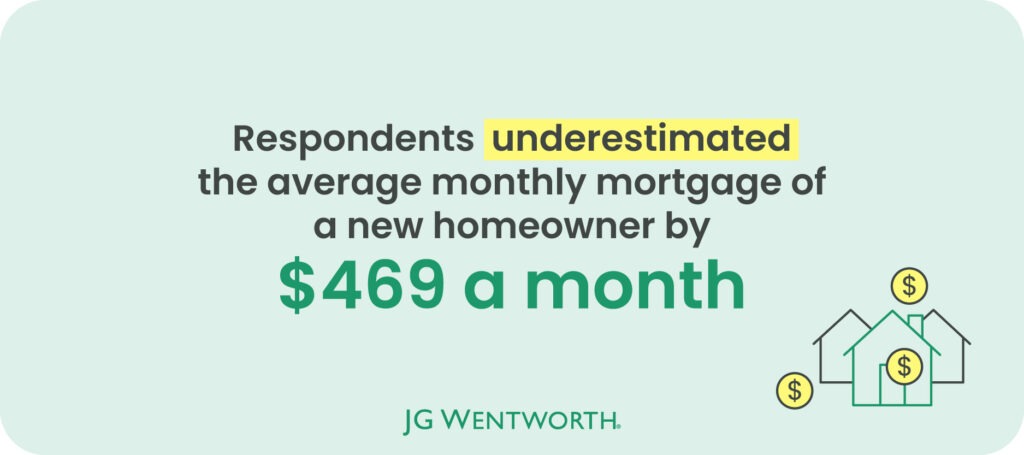
- Respondents underestimated the average monthly mortgage of a new homeowner in the U.S. by $469 a month.
- Respondents underestimated the monthly car loan for a used car by $110 on average, and a new car by $176.
- Respondents overestimated the total student loan debt of a new graduate by $17,969 on average.
- Respondents overestimated the monthly spend on groceries by an average of $179.20 per person per month.
- In 2026, the average American expects their expenses to have increased by $198 per month due to tariffs.
Underestimated and overestimated expenses at a glance
A quick overview of the findings finds that respondents underestimated all costs associated with housing and auto loans, and overestimated both grocery and student loan costs.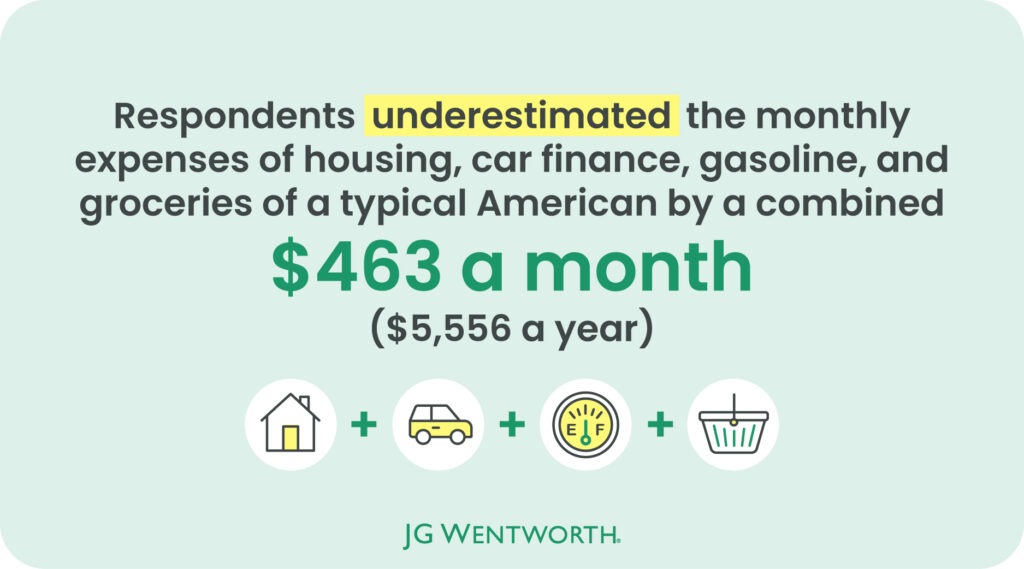
Considering everything that was underestimated, the greatest miscalculation in the study was for the average monthly rent for a house, which was off by $598. Although a smaller price difference ($63 off the actual cost), the greatest miscalculation in terms of percentage difference was for gasoline (36.5% under the actual cost).
| Most underestimated expenses in the study (by $ difference) | ||||||
| Rank | Category | Expenses | U.S. average cost | Survey average estimate | Difference ($) | Difference (%) |
| 1 | Housing | Average monthly rent for a house | $2,349 | $1,751 | -$598 | -29.2% |
| 2 | Housing | Average monthly mortgage payment for a new homeowner (i.e., purchased their home since the start of 2024) | $2,207 | $1,738 | -$469 | -23.8% |
| 3 | Auto | Average monthly payment for a new car loan | $742 | $566 | -$176 | -26.9% |
| 4 | Auto | Average monthly payment for a used car loan | $525 | $415 | -$110 | -23.4% |
| 5 | Housing | Average monthly rent for a typical apartment | $1,503 | $1,439 | -$64 | -4.4% |
| 6 | Auto | Average monthly spend on gasoline | $204 | $141 | -$63 | -36.5% |
Only two of the eight expenses considered in the study were overestimated (taking an average figure from the responses). These were for student loans (which were overestimated by $17,969) and groceries (overestimated by $179.20 a month).
| Most overestimated expenses in the study (by $ difference) | ||||||
| Rank | Category | Expenses | U.S. average cost | Survey average estimate | Difference ($) | Difference (%) |
| 1 | Student loan | Total student loan debt for new graduates | $38,375 | $56,344 | $17,969 | +37.9% |
| 2 | Groceries | Average spend on groceries per month (per person) | $200.80 | $380 | $179.20 | +61.7% |
What do all these miscalculations look like in a real-life scenario? Consider a typical American with an average mortgage, who has an average used car loan, and buys an average amount of groceries and gasoline. The findings suggest that a respondent would underestimate the monthly expenses of this person by $463 a month ($5,556 a year).
Estimated vs actual average housing costs
Rent costs
If you spend more than 30% of your income on rent, mortgage repayments, or housing costs, the U.S. The Department of Housing and Urban Development (HUD) considers you “cost-burdened”. [2] In 2023, the average amount a renter in the U.S. spent on rent was 31% of their income, just over this threshold. [2]
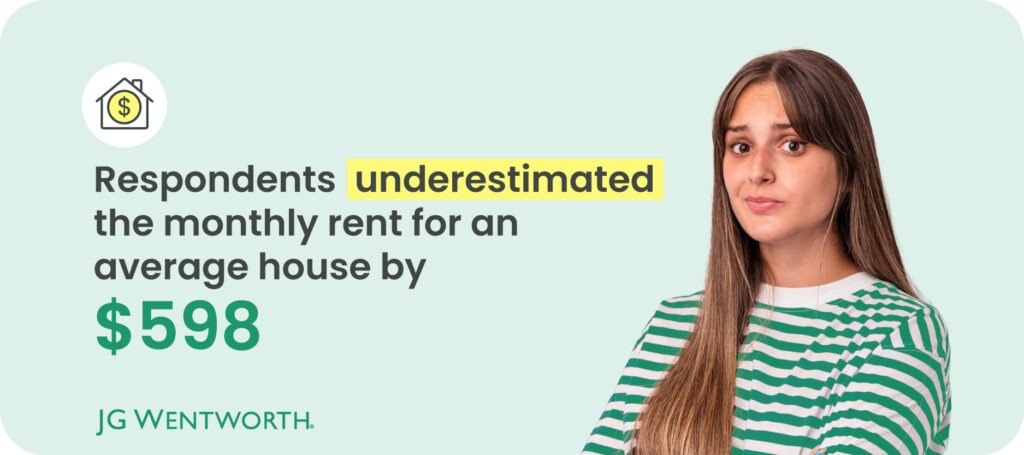
Trying to meet this 30% recommendation is becoming increasingly difficult, and a shortage of over 4.5 million homes has worsened affordability. [3] Taking averages from Zillow data, the average rent of an apartment is $1,503 a month and $2,349 a month for a house. [4] Respondents were pretty accurate at estimating the average rent for an apartment. The mean guess was $1,439 a month, just $64 dollars off. However, respondents were much worse at correctly guessing the cost to rent a house. The average answer was $1,751 – a $598 underestimate.
Mortgage costs
Homeownership is a cornerstone of realizing the “American Dream”. However, a home affordability study by Bankrate found that Americans needed a six-figure salary to afford a mortgage on a median-priced home in nearly half of the U.S. states, and according to their monthly mortgage payment study, the average monthly mortgage in the U.S. was $2,207 in 2024. [5] Respondents in the study guessed the average monthly mortgage to be $1,738 a month – a $469 underestimation.
| Estimated vs actual average housing costs (by $ difference) | ||||
| Expenses | U.S. average cost | Survey average estimate | Difference ($) | Difference (%) |
| Average monthly rent for a house | $2,349 | $1,751 | -$598 | -29.2% |
| Average monthly mortgage payment for a new homeowner (i.e., purchased their home since the start of 2024) | $2,207 | $1,738 | -$469 | -23.8% |
| Average monthly rent for a typical apartment | $1,503 | $1,439 | -$64 | -4.4% |
Estimated vs actual average costs to finance a new or used car
Costs to finance a new car
A 2022 study by the U.S. Department of Transportation Federal Highway Administration found that 91.7% of U.S. households had at least one vehicle in 2022. [6] Although common, buying a car is a sizable investment. The average price of a brand-new car in 2024 was just shy of $50,000, whereas a used car had an average purchase price of $27,000. [7] One way to afford the purchase of a new or used car is by taking on an auto loan, and car loans are one of the most common forms of personal debt. By the end of 2024, it was found that Americans owed $1.655 trillion in auto loan debt, and 80.4% of new cars were financed. [8] A study by Experian estimates that the average monthly payment on a new car loan in the U.S. is $742, but how accurately did respondents guess this amount? [9] Overall, the average guess in the study was $566 for a new car — $176 below the actual cost.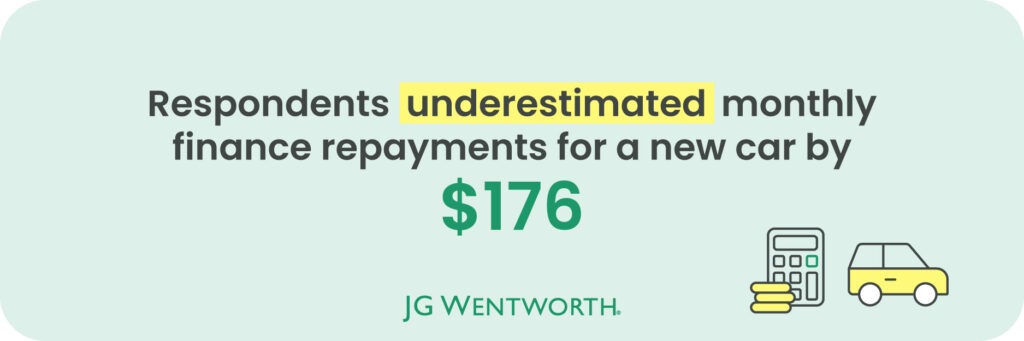
Costs to finance a used car
Buying a used car is a good way to save money, and the more popular choice: used car sales represent three-quarters of all car sales. [10] Although respondents were again fairly accurate in guessing the length of time it takes to pay off a used car loan (with a guess of five years, not far off the 5 years 7 months average).| Estimated vs actual average auto finance costs (by $ difference) | ||||
| Expenses | U.S. average cost | Survey average estimate | Difference ($) | Difference (%) |
| Average monthly payment for a new car loan | $742 | $566 | -$176 | -26.9% |
| Average monthly payment for a used car loan | $525 | $415 | -$110 | -23.4% |
Estimated vs actual average gasoline costs
But paying off auto finance (and paying auto insurance) aren’t the only monthly costs to consider when owning a car. Gas prices vary across the country due to factors like local taxes and regulations. The price per gallon can also be volatile. In 2016, it was at its lowest ($1.72) and peaked in 2022 ($5.01) according to the weekly gas prices. [11] A report by the Motley Fool found that Americans spend $204 on gas each month ($2,449 a year) on average. [12] Again, the respondents underestimated this monthly expense by $63 (with a mean average guess of $141).| Estimated vs actual average gasoline costs | ||||
| Expenses | U.S. average cost | Survey average estimate | Difference ($) | Difference (%) |
| Average monthly spend on gasoline | $204 | $141 | -$63 | -36.5% |
Estimated vs actual average grocery costs
Besides student loan costs, there was only one other expense that respondents overestimated. Considering that the average household in the U.S. is around 2.51 people, and that the average household spend on groceries is $504 per month, the average person spends $200.80 on their monthly grocery shop. [13] [14] However, the survey’s average answer was $380 – $179.20 over the household average. This is interesting considering that groceries are one expense that has increased sharply over time. The Bureau of Labor Statistics (BLS) tracks the changing prices of nearly 400 items. Between February 2020 and April 2025, the top three items that jumped most in price were grocery items: eggs, frozen noncarbonated juices and drinks, and margarine. [1]| Estimated vs actual average grocery costs | ||||
| Expenses | U.S. average cost | Survey average estimate | Difference ($) | Difference (%) |
| Average spend on groceries per month (per person) | $200.80 | $380 | $179.20 | +61.7% |
Estimated vs actual average student loan costs
According to the Department of Education, at the end of 2024, the average student loan debt was $38,375, which is almost double the average student debt of 2008. [15] Despite this sharp increase in costs, when asked to guess how much the average total student loan debt would be for a new graduate today, the mean average was $56,344. This is a $17,969 (37.9%) overestimate and the greatest overestimate for the cost of any expense in the study. Only 10.3% of respondents correctly guessed that the average amount was between $30,000 and $39,999. But which age group is most likely to guess the correct amount? Recent graduates were shown to be the most informed on the costs. Gen-Z respondents (aged between 18-28) were most likely to correctly guess that $30,000 and $39,999 (14.4%), whereas Boomer respondents (aged between 61-70 years old) were almost three times more likely than average to incorrectly guess that the costs were above $100,000 (31.6% compared to 11.9%).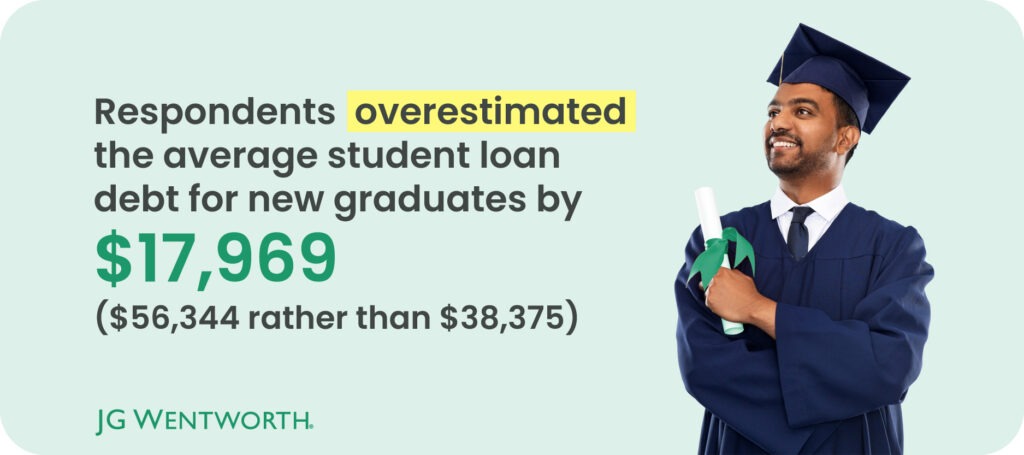
| Estimated vs actual average student loan costs | ||||
| Expense | Actual estimation | Survey average | Difference ($) | Difference (%) |
| Total student loan debt for new graduates | $38,375 | $56,344 | $17,969 | +37.9% |
How much did respondents believe tariffs would impact their monthly expenditure?
In April, President Trump announced his plan to raise tariffs (taxes on imported goods). For context on how impactful these proposed plans are, in 2017, tariffs were around 1.7%, in Trump’s previous term, they were raised to 3%, and the policies announced in April would increase the average tariffs to 22.5%. [16] President Trump has assured Americans that the initiative is part of a long-term strategy: to raise revenue, to negotiate better trade agreements, and to encourage Americans to buy local and support American industries. [17] However, the immediate impact of the announcement alone sent shockwaves through the global stock market. On a longer scale, investment bank JP Morgan upped its prediction of a global economic recession from 40% to 60%. [17] Critics say the tariffs don’t just hurt the global economy, but will harm the average American consumer too. The Yale Budget Lab has projected that the tariffs could cost Americans an average of $4,900 per household. [18] But did respondents agree with these gloomy predictions, or have trust in President Trump’s strategy? When asked to look ahead a year and consider how much they thought tariffs would impact their everyday costs, respondents thought on average it would raise costs by $198 per month.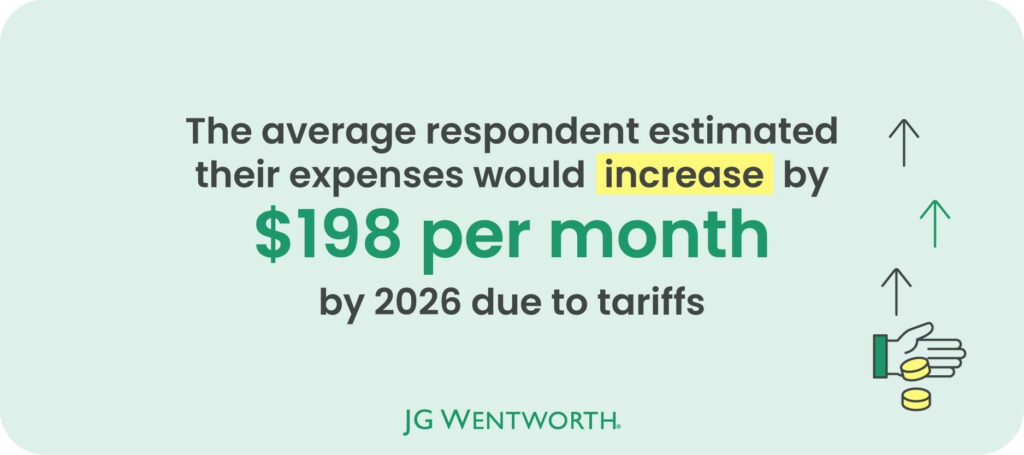
| Amount respondents believed their expenses would have changed in 12 months time (May 2026) | |
| Amount ($) | % of respondents |
| Reduction | 1.9% |
| No change | 3.6% |
| $0 – $20 increase | 3.7% |
| $21 – $50 increase | 8.2% |
| $51 – $100 increase | 15.9% |
| $101 – $150 increase | 16.6% |
| $151 – $200 increase | 13.7% |
| $201 – $250 increase | 11.4% |
| $251 – $300 increase | 6.0% |
| $301 – $500 increase | 6.9% |
| More than a $500 increase | 12.0% |
Methodology
A survey on behalf of JG Wentworth was conducted in May 2025 and asked 1,049 adults to estimate the average costs of typical living expenses and student loans. These questions covered housing expenses (mortgages and rent), car loans (including both used and new cars), gasoline costs, groceries, and student loans. The survey also asked respondents to estimate how much the trade tariffs would impact their future living expenses. Sources used for the average costs are footnoted in the copy and can be found below. To represent a typical American, a mortgage owner and used car loan holder were considered. This is because an estimated 65.1% of Americans are homeowners, and 60.7% of homeowners have a mortgage. This reflects 39.5% of all Americans, which is a greater proportion than the estimated 34% who rent. Used car sales represent three-quarters of all auto sales, and one-third of these purchases are estimated to have used car finance, which is 24.9% of all auto purchases. It was also assumed that a typical individual would buy groceries and fuel their car with gasolineThe demographics of the survey respondents were:
Gender:- Female 52.8%
- Male 45.8%
- Non-binary 1.2%
- Prefer not to say 0.2%
- 18 – 28 10.6%
- 29 – 44 66.5%
- 45 – 60 18.5%
- 61 – 70 3.6%
- 71 – 79 0.7%
- 80+ 0.1%
- Less than $25,000 15.4%
- $25,000 – $49,999 28.6%
- $50,000 – $74,999 34.2%
- $75,000 – $99,999 12.2%
- $100,000 or more 9.5%
Sources
[1] Bankrate, “Latest Inflation Statistics: The Prices Rising And Falling Most”, 2025 [2] United States Census Bureau, “Nearly Half of Renter Households Are Cost-Burdened, Proportions Differ by Race”, 2024 [3] U.S. Chamber of Commerce, “The State of Housing in America”, 2025 [4] Zillow Rental Manager, “Average Rental Price in US & Market Trends”, 2025 [5] Bankrate, “Study: Six-Figure Income Needed To Afford Home In More Than Half Of U.S.”, 2025 [6] Forbes Advisor, “Car Ownership Statistics 2025”, 2025 [7] U.S. News, “Complete Guide: How to Buy a Used Car”, 2024 [8] Spectrum Local News, “USA CAR Act would make auto loan interest tax deductible for American-made vehicles”, 2025 [9] Experian, “State of the Automotive Finance Market report”, 2024 [10] ConsumerAffairs, “Used Car Statistics 2025”, 2025 [12] CBS News, “CBS News price tracker shows how much food, gas, utility and housing costs are rising”, 2025 [12] The Motley Fool, “How Much Do Americans Spend on Gas Every Month?”, 2025 [13] Statista, “Average size of households in the U.S. 2023”, 2023 [14] BLS Reports, “Consumer expenditures in 2023”, 2023 [15] Federal Student Aid, “Standard Repayment Plan” [16] Axios, “Tariffs 101: What they are and how they work”, 2025 [17] Reuters, “Trump tariffs sow fears of trade wars, recession and a $2,300 iPhone”, 2025 [18] The Budget Lab at Yale, “State of U.S. Tariffs: April 15, 2025”, 2025
About the author


